You should spend about 20 minutes on this task.
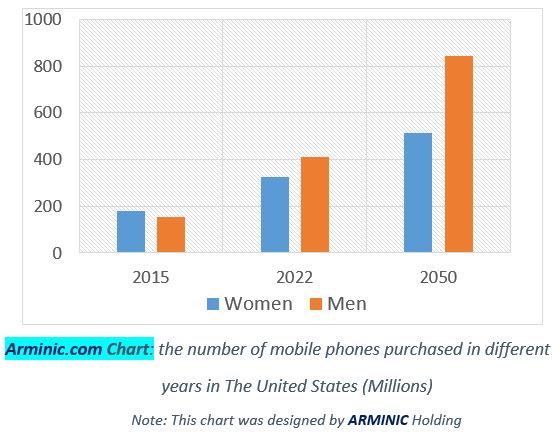
The Arminic.com Bar chart meticulously portrays the quantity of mobile phones procured in The United States over three distinct periods: 2015, 2022, and 2050, expressed in millions. This data is categorized by gender, providing insights into the mobile phone purchasing trends among men and women.
Summarize the information by selecting and reporting the main features and make comparisons where relevant.
(Write at least 150 words)